glycoTS
Example Use Case: C-Mannosyltransferase Pathway
Getting started with glycoCARTA
GlycoCARTA is a web tool for exploring glycogene and glycopathway expression at the single-cell level and in a cell type-specific manner. The available cell types are epithelial, endothelial, stromal, and immune cells.
In the following, we use GlycoCARTA to explore the expression of C-mannosyltransferases, enzymes that mediate the C-mannosylation of proteins at tryptophan residues, in epithelial cells.
Inputting glycogenes to glycoCARTA
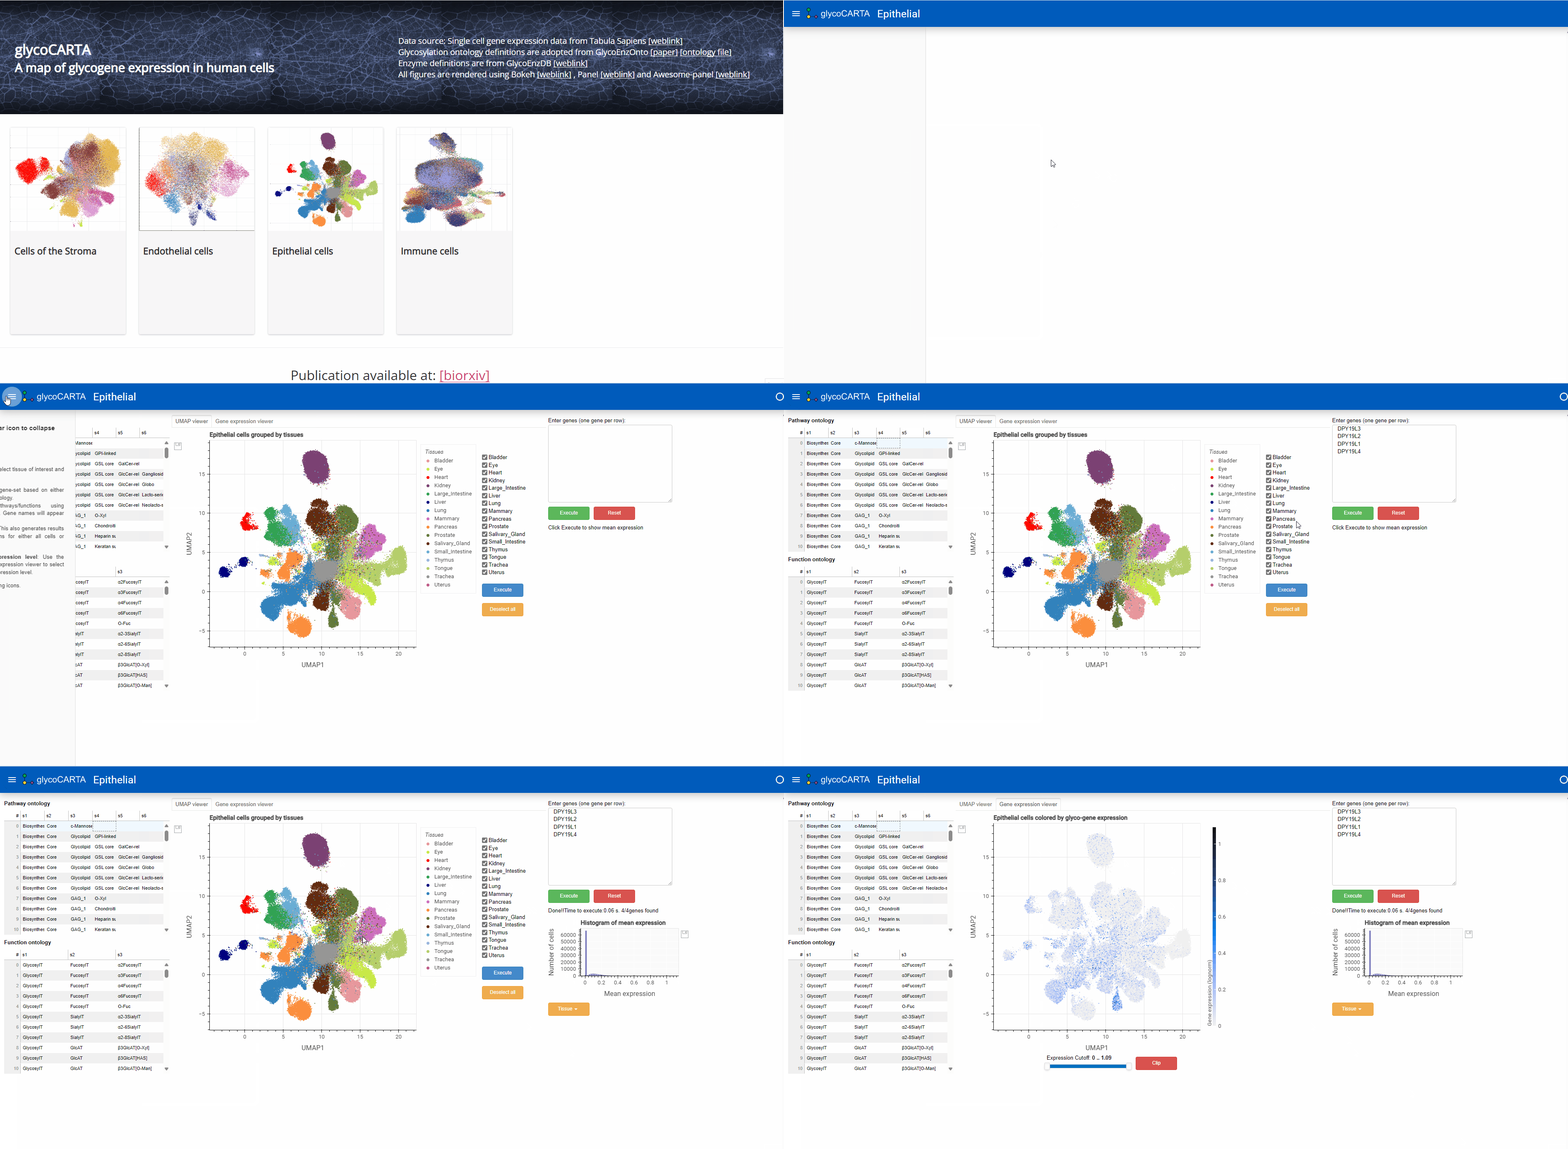
- As shown in the animation above, we start by selecting ‘Epithelial cells’ on the main page of GlycoCARTA.
- Instructions for using GlycoCARTA are provided in the left-most panel, which can be toggled on or off by clicking the menu button at the top left.
- GlycoCARTA starts with a UMAP viewer of scRNA-seq data. The colors represent the tissues of origin.
- Glycogenes of interest can either be manually entered in the box at the top right (one gene per line) or selected from groups based on pathway or functional ontology (left panel).
- Here, we proceed by selecting the ‘c-Mannose’ pathway in the Pathway Ontology. This will pre-fill the genes for C-mannosyltransferases in the user-input box: DPY19L3, DPY19L2, DPY19L1, DPY19L4.
- Once the genes are entered (by pressing the “Execute” button), the average single-cell expression (log1p normalized) of the genes is shown in two ways:
- a histogram of the gene expression (below the input box)
- A UMAP plot (by selecting the “Gene expression viewer” tab at the top)
- Note that the user can save any plot by clicking the “Save” button next to the plot.
Filtering cells based on expression
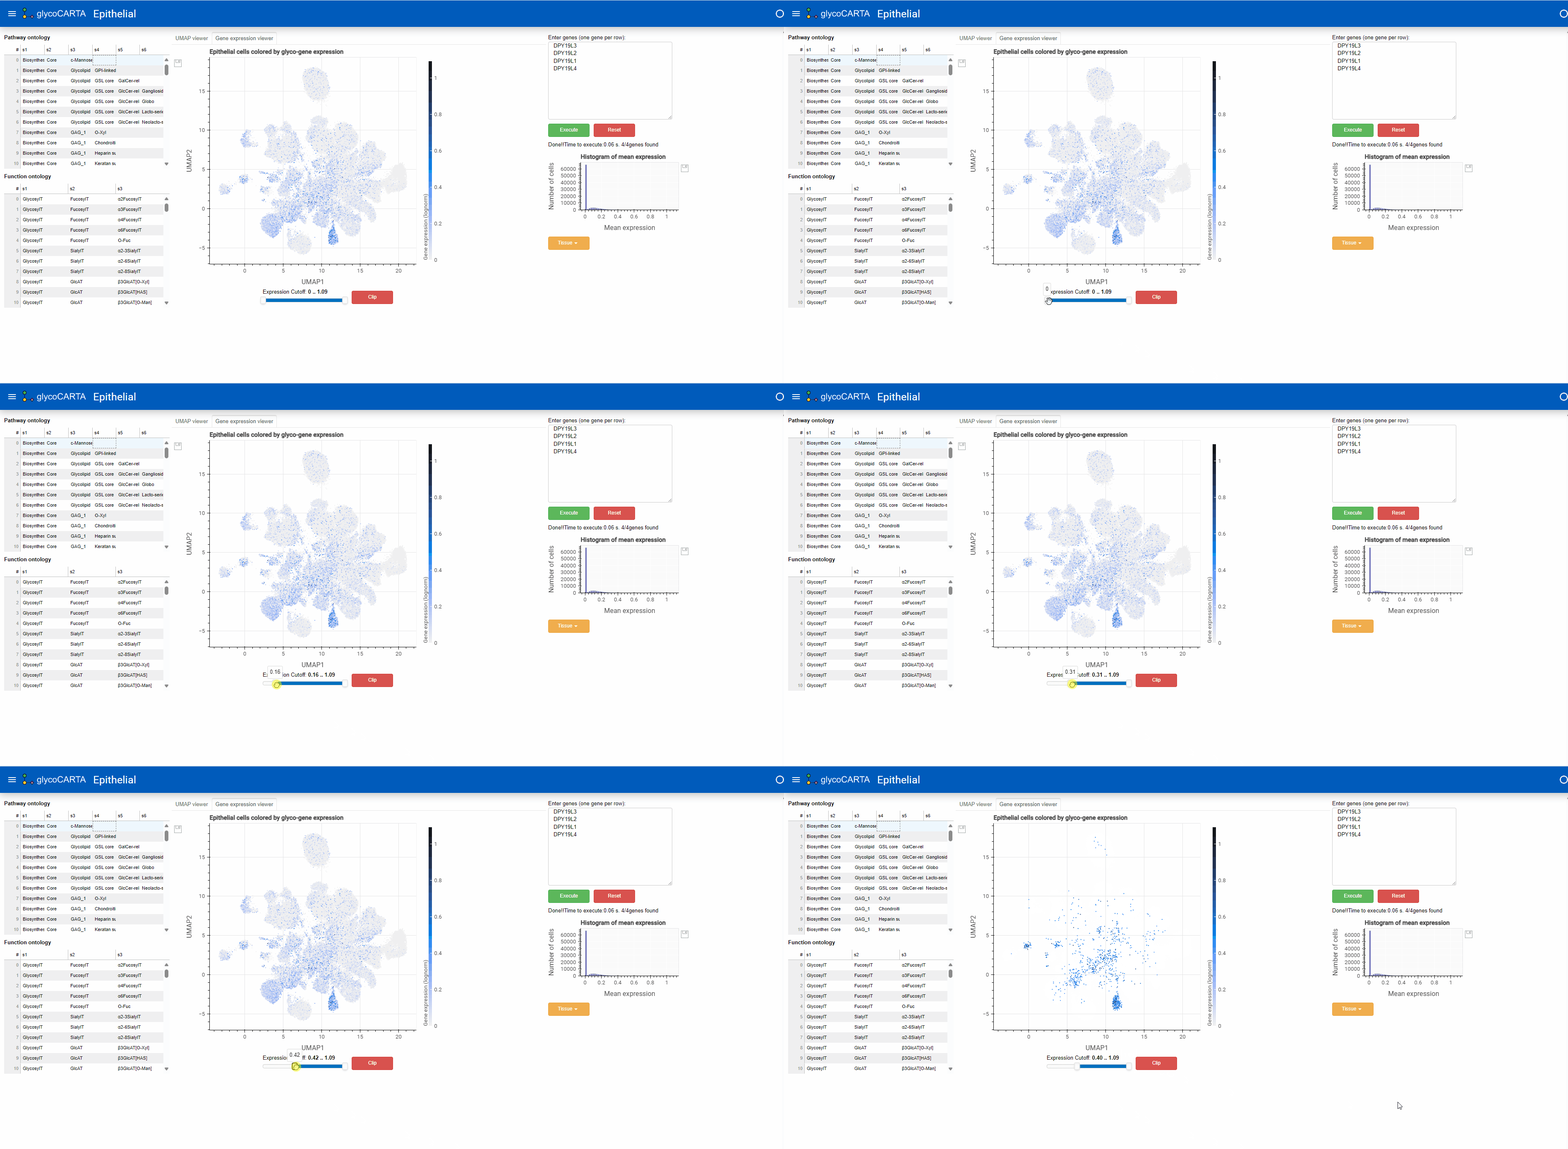
- In the “Gene expression viewer” tab, users can filter the cells to be plotted based on expression threshold values by using the slider below.
- In this example, we set the filter to show cells with an average expression greater than 0.4. Note that the maximum average (normalized) expression is 1.09.
Exploring tissues of origin
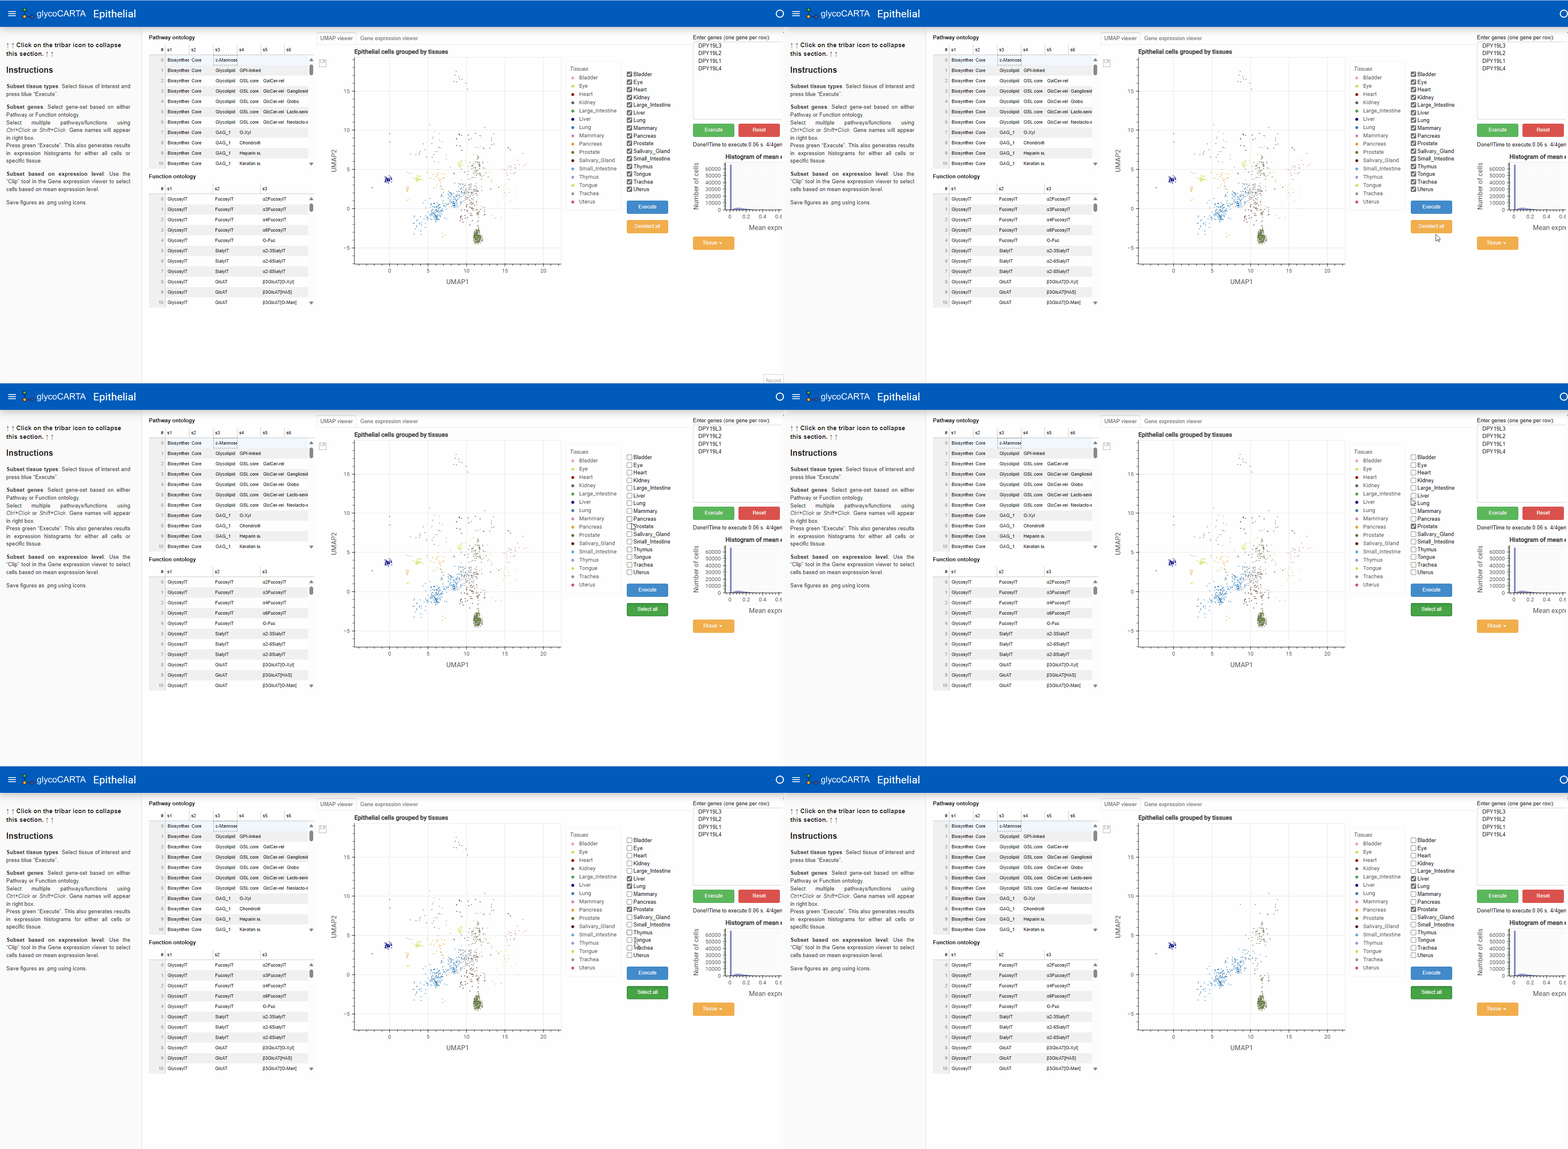
- After filtering the cells based on the average expression, we explore the tissues of origin for these cells.
- As shown in the animation above, we switch to the “UMAP viewer” from the “Gene expression viewer”.
- Based on the colors, we identify cells with high expressions of C-mannosyltransferases in the prostate, liver, and lung tissues.
Exploring tissue-specific expression
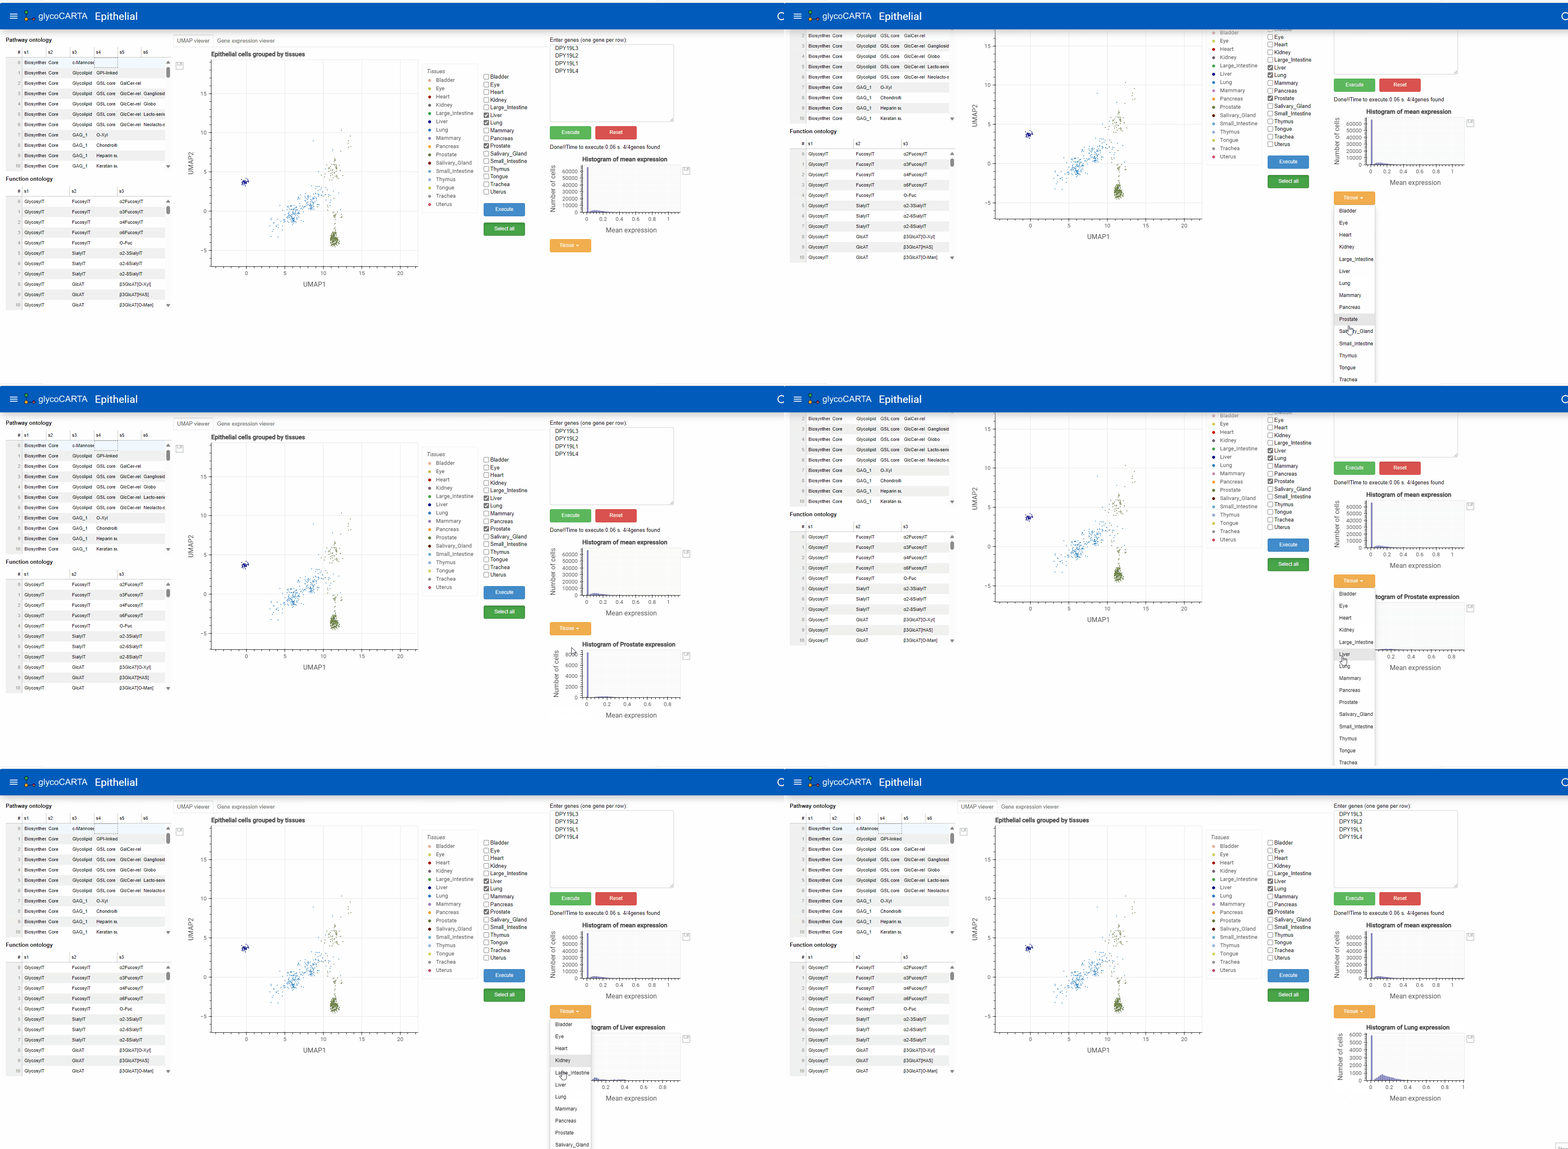
- As illustrated in the animation above, users can generate histograms of single-cell expressions for specific tissues.
Getting started with glycoTF
GlycoTF provides a webtool for exploring the transcription factors (TFs) for glycogenes.
In the following, we use glycoTF to identify candidate TFs for the genes related to c-Mannosyltransferases.
Inputting glycogenes to glycoTF
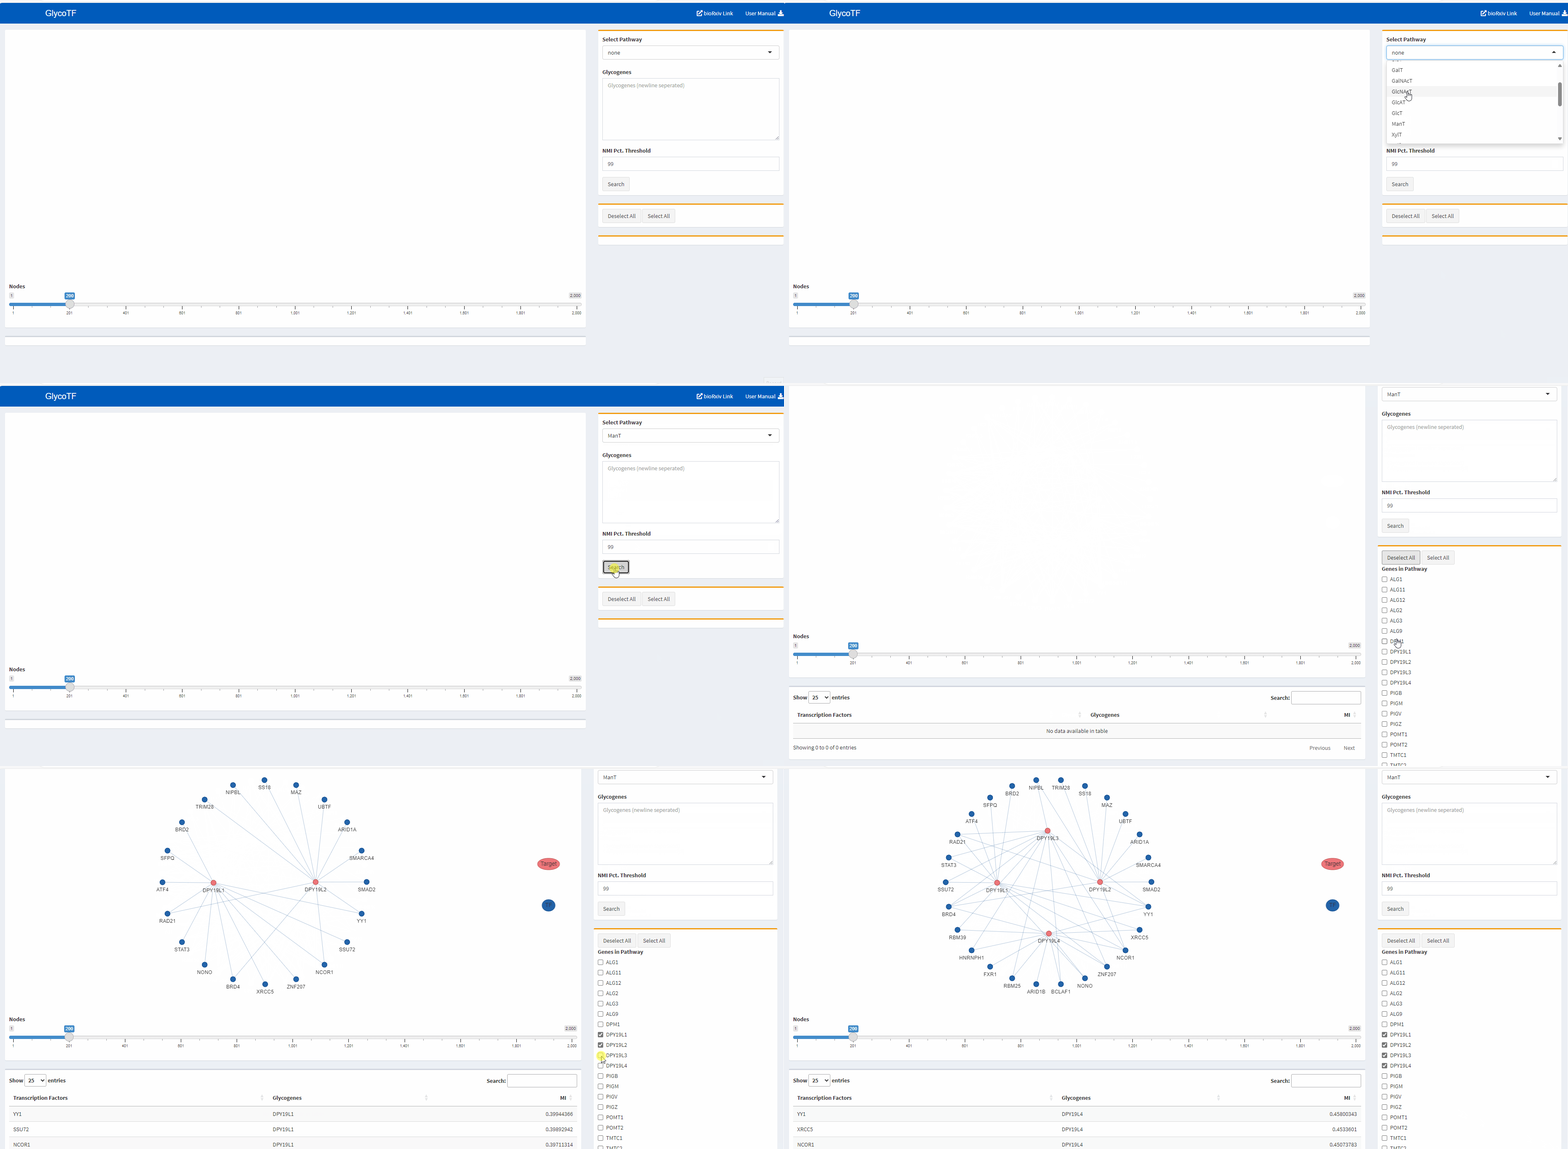
- Glycogenes can either be selected from the list of glycopathways or entered in the search box (one gene per line).
- In the animation above, we select the pathway “ManT” (mannosyltransferase).
- We use the default threshold of the 99th percentile as the cut-off for the Mutual Information (MI) scores. For each gene, only TF-gene MI scores that are above this threshold are shown.
- By clicking the “Search” button, glycoTF generates TF-gene results in two ways:
- TF-glycogene graph
- TF-glycogene table
- Since we are interested only in c-Mannosyltransferases in this use-case, we refine the gene list to only c-Mannosyltransferases by selecting: DPY19L3, DPY19L2, DPY19L1, DPY19L4.
Exploration of TF-Glycogene result
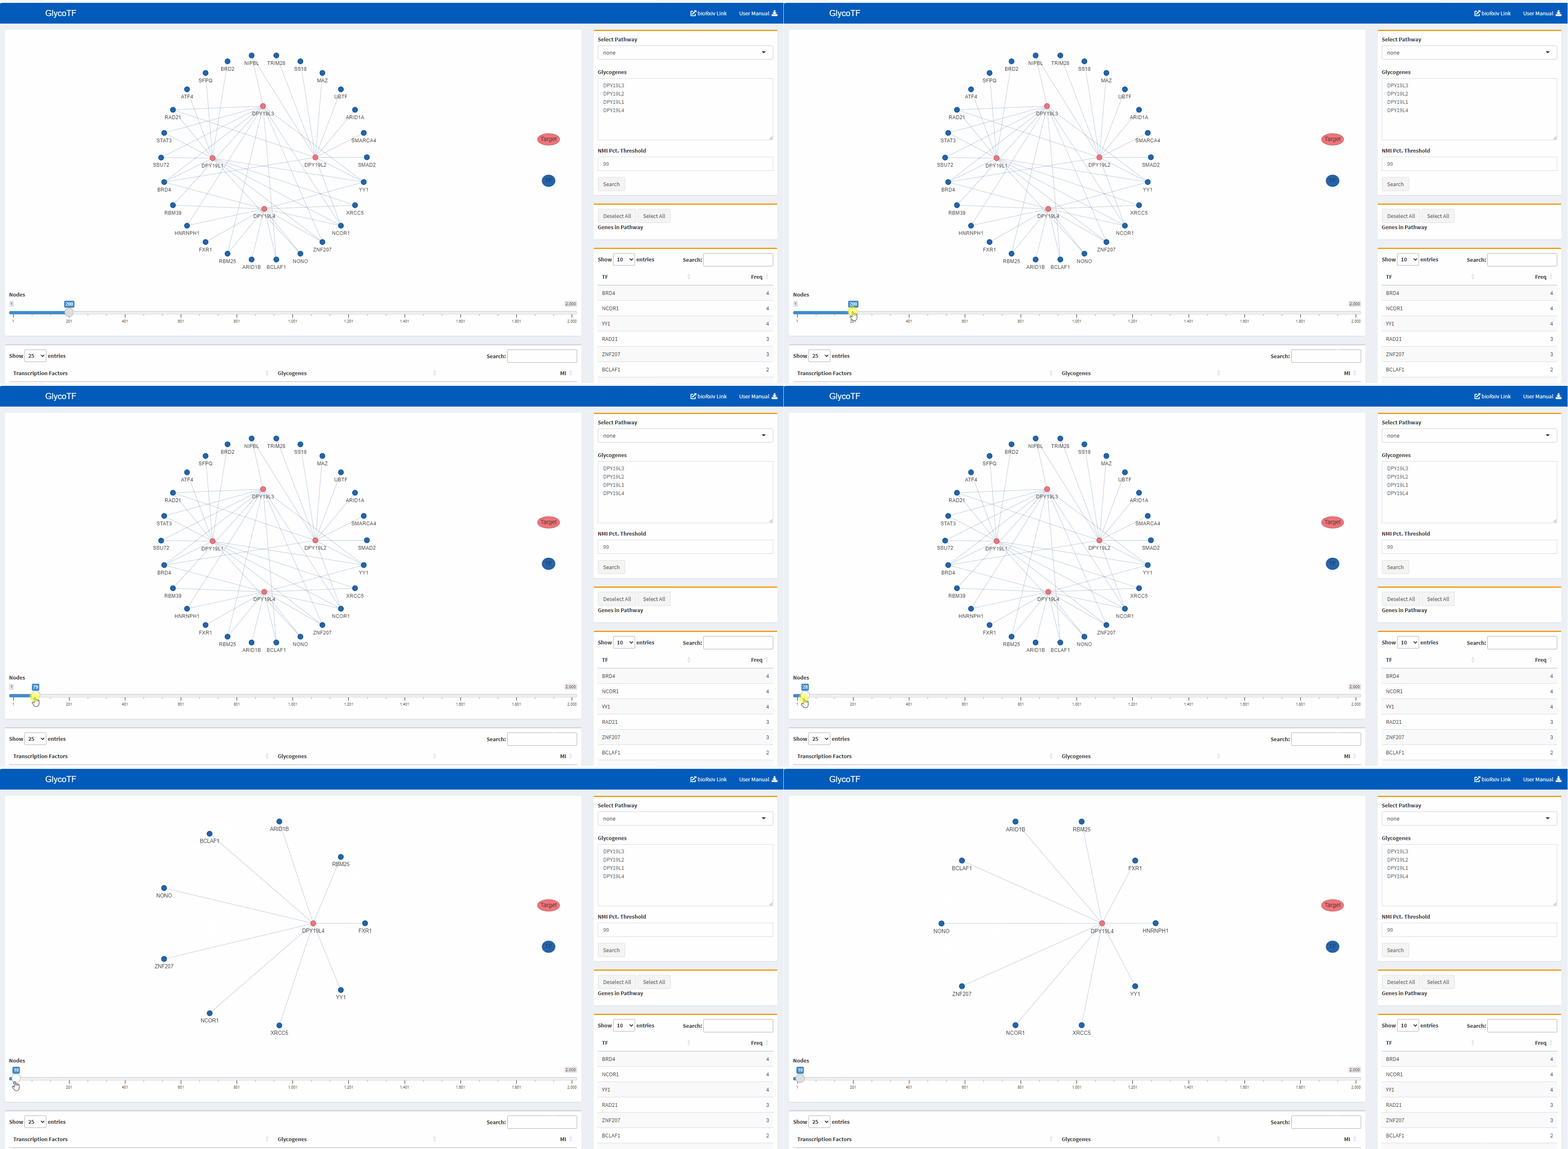
- The default presentation of the TF-glycogene results in the table is in decreasing order of the MI scores. Users have the option to re-sort the results based on TFs or glycogenes in alphabetical order.
- The default presentation of the TF-glycogene graph displays the top 200 TF-glycogene linkages based on the MI scores. Users have the option to increase or decrease the number of linkages shown by using the slider at the bottom of the panel.